
Power BI Course in Chandigarh : Transform Data into Insights
Introduction to Data Analytics and Business Intelligence
In today’s digital world, businesses generate massive amounts of information every single day. From sales figures to customer feedback, data is everywhere. However, raw data on its own is not very useful. It needs to be processed, analyzed, and presented in a way that makes sense. This is exactly where Business Intelligence (BI) comes in, helping companies turn confusing numbers into clear, actionable strategies.
Why Data is the New Oil
You may have heard the phrase, “Data is the new oil.” Just like crude oil, data must be refined before it holds true value. Companies across the globe are hunting for skilled professionals who can extract meaningful trends from massive datasets. By enrolling in a Power bi course in Chandigarh, you are taking the first step toward mastering this highly sought-after skill. Learning how to refine data opens up incredible career opportunities in almost every industry.
The Role of Business Intelligence Today
Business Intelligence tools allow organizations to monitor their performance in real-time. Instead of waiting weeks for a manual report, managers can look at a digital dashboard and instantly see what is working and what is not. This rapid decision-making process is critical for survival in a competitive market.
What is Power BI?
Power BI is a powerful, user-friendly software developed by Microsoft. It is designed to connect to various data sources, clean the data, and transform it into beautiful, interactive visual reports.
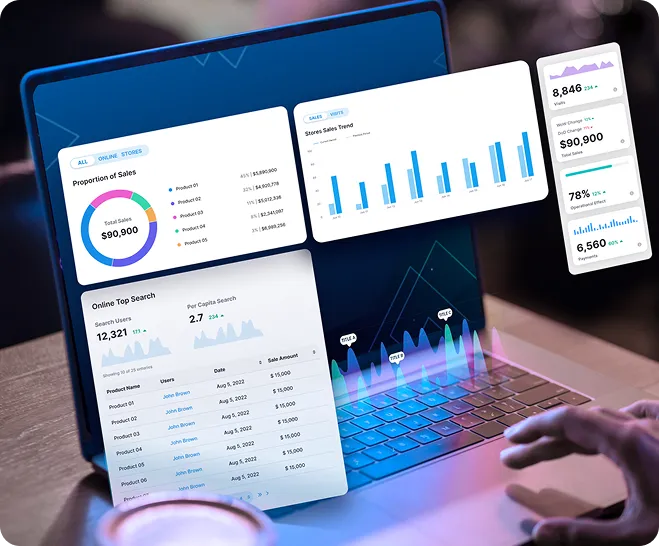
Bridging the Gap Between Data and Decisions
Before modern tools existed, analyzing data required deep programming knowledge. Power BI changes the game by offering a drag-and-drop interface that makes complex data analysis accessible. Whether you are dealing with a simple Excel spreadsheet or a massive cloud-based database, Power BI brings all your information into one unified view.
Key Features that Make Power BI Stand Out
- Seamless Integration: It easily connects with other Microsoft products and hundreds of third-party applications.
- Interactive Visualizations: Users can click on charts and graphs to filter data instantly.
- Automated Updates: Once a dashboard is built, it can automatically refresh itself as new data comes in.
- Security: It offers robust security features to ensure sensitive company information remains safe.
Why Choose a Power BI Course in Chandigarh?
Chandigarh’s Growing IT Landscape
Chandigarh and its surrounding areas, including Mohali, have rapidly transformed into a major technology and business hub. With multinational corporations and innovative startups setting up offices in the region, the demand for tech-savvy professionals is at an all-time high. Taking a Power bi course in Chandigarh , Mohali places you right at the center of this booming job market.
High Demand for Data Professionals in Punjab and Haryana
The need for data analysts is not limited to the IT sector. Manufacturing, healthcare, finance, and retail businesses across Punjab and Haryana are heavily investing in digital transformation. They urgently need professionals who understand Power BI for data analytics to help them optimize their operations, reduce costs, and increase profits.
The Core Systems: Your Trusted Training Partner
A Legacy of Excellence Since 2001
When choosing an institute for your technical education, experience matters. Established in 2001, The Core Systems has built a strong reputation for delivering high-quality, industry-focused education. We have spent over two decades helping students and working professionals build successful careers in the technology sector.

Beyond Training: A Premier Software Development Company
The Core Systems is not just a training center; we are a premier Software Development and AI-driven company. We actively develop corporate and industrial projects across the region. This means our curriculum is not based on outdated textbooks. Instead, it is built around the real-world challenges our own developers face every day.
Alongside data tools, we provide advanced training in AI, Data Science, Full-Stack Web Development (MERN and Python with AI), IoT, IIoT, Embedded Systems, Python, AWS Cloud Computing, Cyber Security, and Linux. This broad expertise allows us to teach you how Power BI integrates with these other cutting-edge technologies.
Power BI for Data Analytics Curriculum
Our training program is designed to take you from a complete beginner to a confident data professional. We break down the learning process into manageable, easy-to-understand phases.
Data Connectivity and Preparation
The first step in any data project is getting the data into the system. You will learn how to connect Power BI to various sources, such as Excel files, SQL databases, and web analytics tools.
Cleaning Messy Data
Real-world data is rarely perfect. It often contains errors, missing values, and duplicates. In this module, you will master the Power Query Editor, a built-in tool used to clean and shape data before it is analyzed. You will learn how to filter out bad data, merge different tables, and create a clean foundation for your reports.
Data Modeling and DAX (Data Analysis Expressions)
Once your data is clean, you need to define how different pieces of information relate to each other. This is called data modeling. You will learn how to build strong relationships between tables to ensure your reports are accurate.
Simplifying Complex Formulas
To get the most out of Power BI, you need to learn DAX (Data Analysis Expressions). DAX is a collection of functions and operators used to create custom calculations. While it sounds intimidating, our instructors break it down into simple, logical steps. You will learn how to calculate year-over-year growth, running totals, and profit margins without writing complex code.
Data Visualization and Dashboard Creation
This is where the magic happens. You will learn how to choose the right type of chart for your specific data story.
Making Data Visual
We will teach you how to build:
- Bar and Column Charts for comparing categories.
- Line Charts for tracking trends over time.
- Maps for visualizing geographical data.
- Cards and KPIs for highlighting critical summary numbers.

By the end of this module, you will be able to design professional, interactive dashboards that allow business leaders to make informed decisions at a glance.
Excel vs. Power BI
Many beginners wonder why they need to learn Power BI if they already know Microsoft Excel. While Excel is a fantastic tool for basic data entry and simple calculations, Power BI is built specifically for heavy-duty analytics.
| Feature | Microsoft Excel | Microsoft Power BI |
| Primary Use | Spreadsheets, simple charts, and data entry | Advanced data visualization and interactive dashboards |
| Data Capacity | Struggles with millions of rows; becomes slow | Easily handles massive datasets securely in the cloud |
| Interactivity | Static charts requiring manual updates | Highly interactive visuals that cross-filter automatically |
| Collaboration | Sending files back and forth via email | Secure, cloud-based sharing with instant access controls |
For a deeper dive into how modern enterprises are transitioning from static spreadsheets to dynamic analytics, check out this industry report: [Insert link to reputable tech journal/site regarding global business intelligence trends].
Who Should Enroll in this Power BI Certification Course?
University Students Looking for a Competitive Edge
If you are currently studying computer science, business, or engineering, adding a Power BI certification course to your resume gives you a massive advantage. Employers are actively looking for fresh graduates who can bring immediate value to their teams. Our hands-on approach ensures you graduate with practical skills, not just theoretical knowledge.
Industry Professionals Seeking Career Growth
For professionals already working in finance, marketing, or IT, mastering Power BI for data analytics is a proven way to accelerate career growth. If you spend hours every week manually compiling reports, this course will teach you how to automate those tasks, freeing up your time for more strategic work.
Practical Training and Hands-On Projects
At The Core Systems, we believe that you cannot learn software just by watching someone else use it. You have to get your hands dirty.
Real-World Corporate Scenarios
Our training is 100% practical. Throughout the course, you will work on datasets that simulate real corporate challenges. You will analyze sales performance for a mock retail chain, track inventory levels for a manufacturing plant, and evaluate marketing campaign success.
Building a Professional Portfolio
By the time you complete the course, you will have built a diverse portfolio of professional dashboards. This portfolio is exactly what you need to show potential employers during job interviews, proving that you possess the skills you claim on your resume.
Career Opportunities After Mastering Power BI
The job market for data professionals is booming. Earning a certification in this field opens doors to a wide variety of lucrative roles.
Top Roles in Data Analytics
- Data Analyst: Responsible for interpreting data and turning it into information that can offer ways to improve a business.
- Business Intelligence Developer: Focuses on creating and managing BI and analytics solutions that turn data into knowledge.
- Data Consultant: Works with different clients to help them understand their data infrastructure and improve their analytics capabilities.

Our dedicated team at The Core Systems also provides guidance on resume building, interview preparation, and placement support across Chandigarh, Mohali, and the wider Punjab and Haryana regions.