
Best Data Analyst Course in Panchkula: Build a Job-Ready Career
Data has become one of the most valuable resources for modern businesses. Companies use data to understand customers, improve operations, measure performance, reduce costs, and make better decisions. Because of this, data analytics has become an important career option for students, freshers, and working professionals.
 The Core Systems
If you are searching for the best data analyst course in Panchkula, choosing a program that combines theory with practical projects is important. A good data analytics program should help you understand how to collect, clean, analyze, visualize, and interpret data.
This is where TheCoreSystems focuses on practical, industry-oriented learning. The organization provides training across areas such as Data Analytics, Data Science, Artificial Intelligence, Python, Full-Stack Development, IoT, IIoT, AWS Cloud Computing, Cyber Security, Linux, and Embedded Systems.
For students and professionals in Panchkula, Chandigarh, Mohali, Punjab, Haryana, and nearby areas, learning data analytics can provide a pathway toward roles such as Data Analyst, Business Analyst, Reporting Analyst, BI Analyst, and Junior Data Scientist.
Why Data Analytics Is a Growing Career Choice
Businesses generate large amounts of information every day.
For example, an organization may have data related to:
- Customer purchases
- Website visitors
- Sales performance
- Employee records
- Marketing campaigns
- Product performance
- Financial transactions
- Customer feedback
- Inventory
- Business operations

Raw data alone does not provide much value. It needs to be processed and converted into useful information.
What Does a Data Analyst Actually Do?
A Data Analyst works with data from different sources and converts it into meaningful insights.
A typical workflow includes:
- Collecting data
- Understanding the dataset
- Cleaning incorrect or missing values
- Transforming data
- Analyzing patterns
- Creating reports
- Building dashboards
- Communicating insights
For example, imagine a company has five years of sales records. The data analyst may clean the dataset, analyze yearly sales, identify the best-performing products, and create a Power BI dashboard for management.
The technical skills matter, but so does the ability to explain what the data means.
What Should You Look for in the Best Data Analyst Course in Panchkula?
Not every course offers the same learning experience.
Before selecting a course, consider whether it covers:
- Excel
- SQL
- Python
- Pandas and NumPy
- Data visualization
- Power BI
- Statistics
- Data cleaning
- Real-world projects
- Portfolio development
- Interview preparation
A strong course should move from basic concepts to practical implementation.
Students should not simply watch demonstrations. They should also work with datasets, create reports, solve problems, and build projects.
Core Skills You Can Learn in a Data Analytics Course
Excel for Data Analysis
Excel remains an important tool for business reporting and data analysis.
Students can learn concepts such as:
- Formulas and functions
- Sorting and filtering
- Conditional formatting
- Data cleaning
- Lookup functions
- Pivot Tables
- Charts
- Basic dashboards
Excel is especially useful for beginners because it provides an easy way to understand how structured data works.
SQL for Working With Databases
SQL is one of the most useful skills for a Data Analyst.
Organizations often store business information in databases. SQL allows analysts to retrieve and analyze that information.
Important concepts can include:
- SELECT statements
- WHERE conditions
- Sorting
- GROUP BY
- Aggregate functions
- JOIN operations
- Subqueries
- Filtering
- Data aggregation
For example, a business may want to know total sales by region. SQL can help retrieve and summarize this information from a database.
Python for Data Analytics
Python is widely used for data analysis because of its simple syntax and extensive ecosystem.
A practical Python-based analytics curriculum can introduce:
- Variables
- Lists and dictionaries
- Conditional statements
- Loops
- Functions
- File handling
- Exception handling
- Basic object-oriented programming
Once learners understand Python fundamentals, they can move toward libraries used for analytics.
Important Python Libraries
Common libraries include:
- NumPy for numerical operations
- Pandas for data manipulation
- Matplotlib for visualization
- Plotly for interactive visualizations
Python can be especially valuable for students who later want to move from Data Analytics toward Data Science or Artificial Intelligence.
Data Cleaning: One of the Most Important Analyst Skills
Real-world datasets are rarely perfect.
A dataset may contain:
- Missing values
- Duplicate records
- Incorrect data types
- Spelling differences
- Invalid values
- Unnecessary columns
- Inconsistent formats
Before analysis, the data must be cleaned.
This process can involve:
- Finding missing values
- Removing duplicates
- Correcting data types
- Standardizing values
- Handling incorrect records
- Selecting useful columns
Good analysis depends on good-quality data.
This is why data cleaning should be an important part of any Artificial Intelligence course in Mohali or Data Analytics program that aims to prepare students for modern data-driven roles.
Data Visualization and Dashboard Development
Numbers can be difficult to understand when presented only in spreadsheets.
Visualization helps transform numbers into understandable patterns.
Learners can create:
- Bar charts
- Line charts
- Pie charts
- Tables
- KPI cards
- Interactive dashboards
- Trend reports
One of the most popular tools for business intelligence and dashboard creation is Power BI.
A Power BI dashboard can help decision-makers quickly understand:
- Revenue
- Profit
- Sales trends
- Customer activity
- Regional performance
- Product performance
Power BI Skills for Aspiring Data Analysts
Power BI can be an important component of a job-oriented analytics course.
 Power BI
Learners can explore:
- Importing datasets
- Data transformation
- Relationships
- Data modeling
- Visualizations
- Filters
- Interactive reports
- Dashboard creation
- Basic DAX concepts
The goal should not simply be to learn where buttons are located in the software.
Instead, students should understand how to convert business questions into useful reports and dashboards.
Statistics for Data Analysis
Statistics provides the foundation for understanding data.
A beginner-friendly analytics course can introduce:
- Mean
- Median
- Mode
- Range
- Variance
- Standard deviation
- Percentages
- Correlation
- Basic probability
You do not necessarily need advanced mathematics to start a Data Analyst career.
However, understanding basic statistics helps you interpret results correctly and avoid misleading conclusions.
Artificial Intelligence and Data Analytics
Artificial Intelligence is changing the way professionals work with data.
Modern analysts may use AI-based tools to assist with:
- Data exploration
- Query generation
- Report creation
- Pattern identification
- Text analysis
- Automation
- Documentation
This does not mean that traditional analytics skills are becoming unnecessary.
Instead, AI can become an additional productivity tool for analysts who already understand data fundamentals.
This is also why learners interested in analytics may later explore an AI course in Mohali to expand their technical skill set.
Data Analyst Course in Panchkula for Working Professionals
Data analytics is not limited to fresh graduates.
Working professionals from areas such as:
- Finance
- Marketing
- Operations
- Sales
- Administration
- Education
- Engineering
- IT
can benefit from analytics skills.
For example, a sales professional could use Power BI to analyze monthly performance. A marketing professional could study campaign data. An operations professional could identify process trends.
The biggest advantage is that analytics skills can complement an existing professional background.
Career Opportunities After a Data Analyst Course
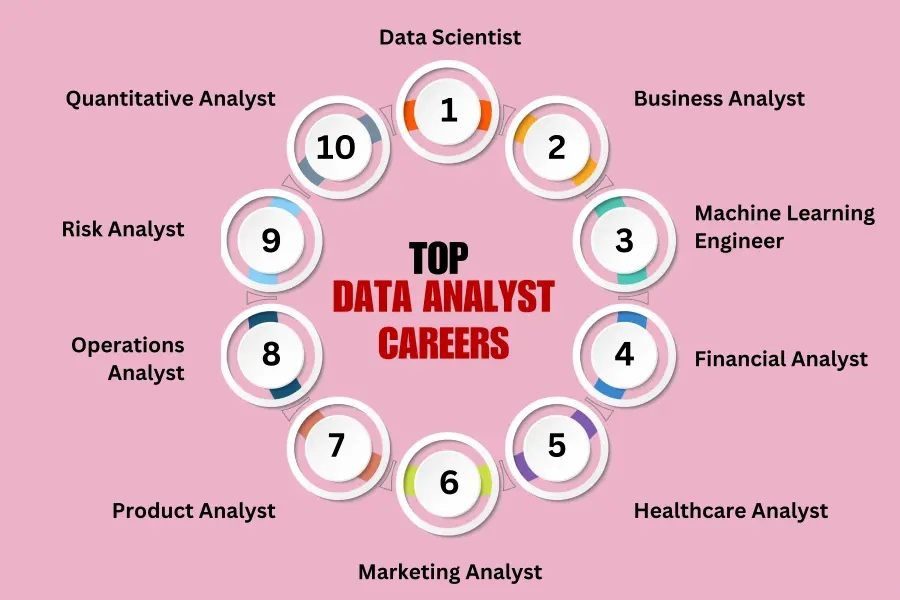 Career Opportunities
After developing the required skills, learners can explore roles such as:
- Junior Data Analyst
- Data Analyst
- Business Analyst
- Reporting Analyst
- BI Analyst
- MIS Analyst
- Data Visualization Analyst
- Junior Data Scientist
Your exact career options depend on your education, technical skills, projects, communication ability, and practical experience.
Data Analyst Skills Employers Often Value
Technical skills are only one part of becoming a successful analyst.
Employers also value:
Analytical Thinking
You should be able to break a problem into smaller questions and use data to investigate it.
Communication
A good analyst must explain findings clearly to people who may not have a technical background.
Business Understanding
Understanding why a company needs an analysis is often more important than simply creating a chart.
Attention to Detail
Small errors in data can lead to incorrect conclusions.
Problem Solving
Analysts frequently work with incomplete or messy information.
How to Choose the Right Data Analytics Training Institute
Before enrolling, consider these factors:
- Course curriculum – Does it cover the tools you actually need?
- Practical learning – Are students working on datasets and projects?
- Trainer expertise – Does the instructor understand real-world applications?
- Portfolio development – Will you finish with projects you can demonstrate?
- Learning support – Can you ask questions when you get stuck?
- Career guidance – Does the institute provide interview or career preparation?
- Location and accessibility – Is the training convenient for you?
- Future learning path – Can you move toward Data Science or AI later?
Data Analytics Learning Roadmap for Beginners
If you are completely new to analytics, follow a structured roadmap.
Step 1: Learn Basic Computer Skills
Understand files, folders, spreadsheets, and basic software usage.
Step 2: Learn Excel
Start with formulas, sorting, filtering, Pivot Tables, and charts.
Step 3: Learn SQL
Understand how databases store information and how to retrieve data.
Step 4: Learn Python
Build programming fundamentals before moving into analytics libraries.
Step 5: Learn Pandas and NumPy
Use Python to manipulate and analyze datasets.
Step 6: Learn Visualization
Understand how to communicate information using charts and dashboards.
Step 7: Learn Power BI
Build interactive business intelligence reports.
Step 8: Build Projects
Work with realistic datasets and document your approach.
Step 9: Build a Portfolio
Show your dashboards, analysis, Python notebooks, and projects.
Step 10: Prepare for Interviews
Practice SQL questions, Python questions, analytics cases, and project explanations.
Data Analytics as a Path Toward Data Science and AI
Data Analytics can also serve as a foundation for advanced technical careers.
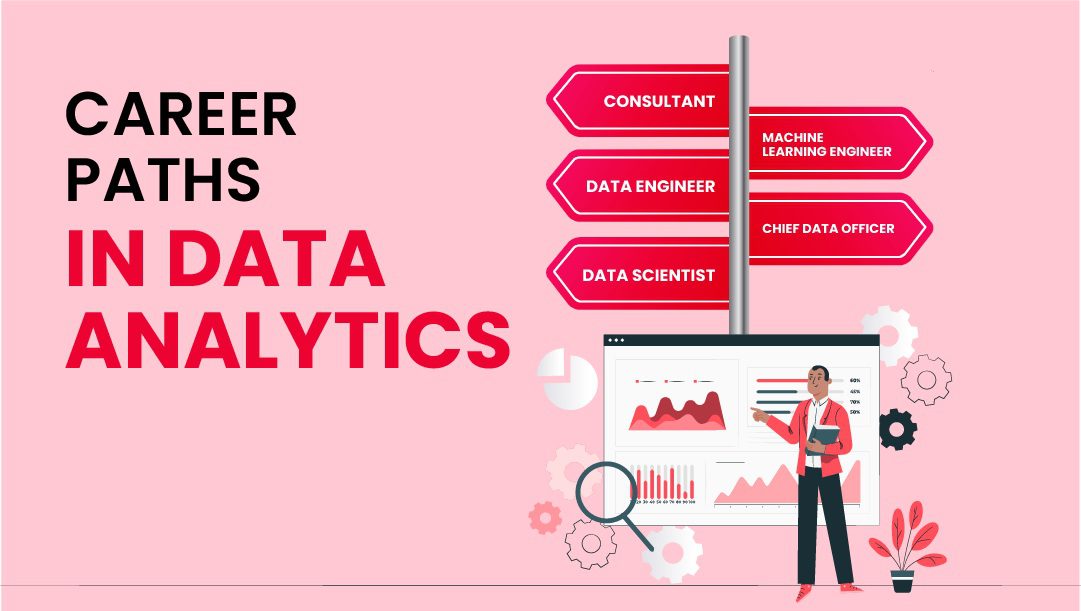 Data Analytics as a Path
After becoming comfortable with:
Excel → SQL → Python → Statistics → Visualization
you can gradually explore:
Machine Learning → Data Science → Artificial Intelligence
Similarly, someone researching an AI course in Mohali for freshers may benefit from first developing Python and data-handling fundamentals.
This creates a logical progression instead of trying to learn advanced AI concepts without understanding data.